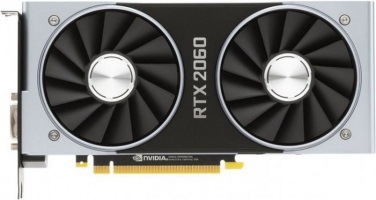

General info
The main nomenclature characteristics of video cards NVIDIA GeForce RTX 2060 and GeForce RTX 3050 Ti Max-Q. Pay attention to the position in the performance rating to choose the best one.
Technical specs
Choose the best graphics card between NVIDIA GeForce RTX 2060 and GeForce RTX 3050 Ti Max-Q based on manufacturing process, power consumption, and base frequency and overclocking potential of the GPU.
Compatibility, dimensions and requirements
Additional technical information, does not greatly affect the performance rating when comparing the NVIDIA GeForce RTX 2060 and GeForce RTX 3050 Ti Max-Q.
Memory
Graphics card memory is used to store calculations. Modern software and 3D games require more and faster memory. The higher these parameters, the more productive the chip. The difference in these characteristics NVIDIA GeForce RTX 2060 and GeForce RTX 3050 Ti Max-Q can be seen in this section.
Video outputs and ports
The difference between the interfaces and ports of video cards NVIDIA GeForce RTX 2060 and GeForce RTX 3050 Ti Max-Q, the size and number of monitors.
Technologies
The difference between NVIDIA GeForce RTX 2060 and GeForce RTX 3050 Ti Max-Q is the additional functionality.
API support
The difference in supported APIs is NVIDIA GeForce RTX 2060 and GeForce RTX 3050 Ti Max-Q. Hardware support (API) is not considered in synthetic benchmarks and performance tests.
Gaming performance
Select form the list the required name to identify gaming performance for NVIDIA GeForce RTX 2060 and GeForce RTX 3050 Ti Max-Q graphics cards. The result shows how fast the game will run and whether it can be run on this computer. The different monitor resolutions – from low to 4K – are used for testing. Find out is the NVIDIA GeForce RTX 2060 or GeForce RTX 3050 Ti Max-Q good for gaming.
|
low
1280x720 |
med.
1920x1080 |
high
1920x1080 |
ultra
1920x1080 |
QHD
2560x1440 |
4K
3840x2160 |
||
| Horizon Zero Dawn (2020) | NVIDIA GeForce RTX 2060 | 146 | 101 | 86 | 69 | 52 | 30 |
| GeForce RTX 3050 Ti Max-Q | |||||||
| Death Stranding (2020) | NVIDIA GeForce RTX 2060 | 173 | 118 | 111 | 107 | 76.4 | 42.3 |
| GeForce RTX 3050 Ti Max-Q | |||||||
| F1 2020 (2020) | NVIDIA GeForce RTX 2060 | 288 | 211 | 172 | 120 | 89 | 52 |
| GeForce RTX 3050 Ti Max-Q | |||||||
| Gears Tactics (2020) | NVIDIA GeForce RTX 2060 | 309 | 193 | 120 | 82.9 | 57.1 | 31.1 |
| GeForce RTX 3050 Ti Max-Q | |||||||
| Doom Eternal (2020) | NVIDIA GeForce RTX 2060 | 281 | 185 | 167 | 162 | 102 | 45.9 |
| GeForce RTX 3050 Ti Max-Q | |||||||
| Legend | |
| 5 | Stutter – Insufficient data. Similar graphics cards stutter, the game is likely to show a low frame rate. There will be some lags. |
| May Stutter – Insufficient data. Similar graphics cards stutter, the game is likely to show a low frame rate. There will be some lags. | |
| 30 | Fluent – According to the results of benchmarks the game should run at 25 frames per second (fps) |
| 40 | Fluent – According to the results of benchmarks the game should run at 35 frames per second (fps) |
| 60 | Fluent – According to the results of benchmarks the game should run at 58 frames per second (fps) |
| May Run Fluently – Insufficient data. Similar graphics cards show a smooth frame rate, comfortable for the game. | |
| ? | Uncertain – Graphics cards testing has shown that a slower card can provide a high and stable frame rate for the same operation. |
| Uncertain – The work of the video card in the game is still being studied. Interpolation among analogs is not possible. | |
| The value depicts the average frame rate. Hovering over the value, you can get individual results. | |
Advantages of NVIDIA GeForce RTX 2060
67.29% faster in synthetic tests
More maximum RAM amount (6 GB vs 4 GB)
More memory bandwidth (336.0 GB/s vs 192.0 GB/s)
G-SYNC support
VR Ready
Multi Monitor
Advantages of GeForce RTX 3050 Ti Max-Q
Finer manufacturing process technology (8 nm vs 12 nm)
So, NVIDIA GeForce RTX 2060 or GeForce RTX 3050 Ti Max-Q?
Judging by the results of synthetic and gaming tests, we recommend NVIDIA GeForce RTX 2060 .
NVIDIA GeForce RTX 2060 versus GeForce RTX 3050 Ti Max-Q performance benchmarks comparison
3DMark Ice Storm GPU | CpusData


